Condensation in Dust-enriched Systems, by D.S. Ebel and L. Grossman,
![]() Geochimica et Cosmochimica Acta, 1999
Geochimica et Cosmochimica Acta, 1999
|
|
 -------------------
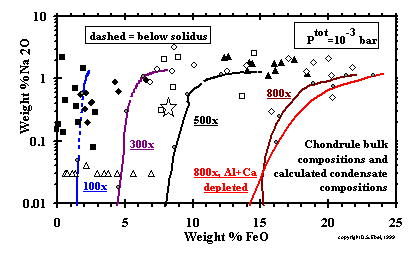
Figure 17: Sodium and iron oxide contents of the chondrules of Fig. 16 and of KLB-1, with representative paths of bulk oxide condensates. Compositions reported as (> or =) 0.03% Na2<O are plotted at 0.03%. (enlarge) ------------------- The FeO and Na2O contents of the same chondrules shown in Fig. 16 are illustrated in Fig. 17. Representative oxide bulk compositions for condensation paths at 100x, 300x, 500x, and 800x dust enrichment, the latter with and without removal of 72 % of the Al2O3 and CaO, at 10-3 bar are superposed on Fig. 17, with the subsolidus portions dashed. The FeO contents of the calculated condensate assemblages at high dust enrichments reach the levels found in chondrules at high temperatures, but Na2O contents only approach the levels found in Na-rich chondrules near the solidus of silicate liquid. The compositions of the chondrules richest in both Na2O and FeO, which include the Type IIA and IIB chondrules of Jones (1990; 1996) and many of those reported by Dodd (1978), are more Na2O-rich than compositions on any of the equilibrium condensation paths calculated under the conditions investigated here. This result precludes formation of these particular chondrules by representative sampling of equilibrium condensate assemblages from dust-enriched systems at specific temperatures, either by quenching and isolating primary condensates or by isochemical melting and quenching of such samples at Ptot (> or =)10-3 bar and dust enrichments (> or =)1000x. Dust enrichment factors of >800x are not required, however, to produce the iron contents observed in most chondrules. If the FeO contents of chondrules did result from the formation and isolation of their precursors in a dust-enriched environment, their Na contents may have resulted from some secondary, as yet unspecified process. |
 -------------------
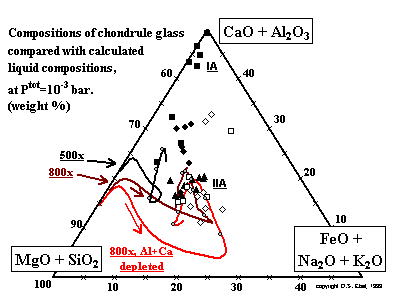
Figure 18: Glass compositions in chondrules, with paths of condensate liquids for 500 and 800x C1 dust enrichment, from below the appearance temperatures of olivine to their solidi. Symbols for chondrule data as in Fig. 16. Grey circles on each path mark hundred degree decrements starting at 1700K. (enlarge) ------------------- Are there conditions for which the liquids in equilibrium with dust-enriched vapor have the same compositions as the glass found in chondrules? Plotted on Fig. 18 are the compositions of the mesostasis from most of the chondrules whose bulk compositions are illustrated in the previous two figures. The axes of Fig. 18 are the same as those of Fig. 16, and the composition trajectories for the liquid fraction of the condensates at two dust enrichments are superposed on Fig. 18, starting at the temperature where olivine first condenses, and the transition from CMAS to MELTS liquid models occurs. The calculated liquids move away from forsterite toward the CaO + Al2O3 apex, then begin to become enriched in iron. Once past the peak in iron content, the paths differ in trajectory, due to differences in the proportions of crystallizing olivine and orthopyroxene, and liquid. Continuing olivine and pyroxene crystallization drives the liquid trajectory steeply away from the MgO + SiO2 corner, causing CaO and Al2O3 concentrations to rise in the liquid until feldspar and pyroxene crystallize, very near the solidus, driving CaO and Al2O3 downward again. |
 -------------------
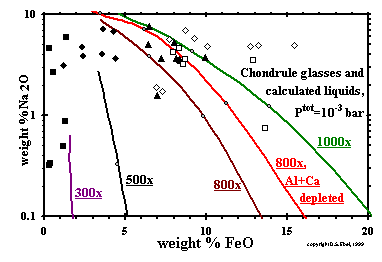
Figure 19: Glass compositions in chondrules, with paths of condensate liquids for 300, 500, 800 and 1000x C1 dust enrichment, which terminate at their solidi. Data as in Fig. 18. (enlarge) ------------------- The liquid paths in Fig. 18 suggest that chondrule glasses with high FeO + alkali oxide contents could have equilibrated with a highly dust-enriched gas at 10-3 bar. The glass compositions observed in Type IA chondrules, however, contain much less MgO + SiO2 than any FeO- or alkali-bearing liquids in equilibrium with dust-enriched vapor. In these particular chondrules, it is mostly Na2O content which pulls the liquid composition off the CMAS join, into the interior of the triangle. This can be seen in Fig. 19, which shows glass compositions of the same chondrules, with paths of liquid composition for four dust enrichment factors superposed. Type IA chondrules fall closest to the y-axis. In the case of 1000x enrichment at 10-3 bar, the FeO contents of calculated liquids increase to >25 wt% while Na2O <0.1 wt%, then decrease with decreasing temperature. Past the peak in FeO content, Na begins to condense into liquids, and Na2O concentrations increase steeply near the solidus, at which points the curves in Fig. 19 terminate. Prior to Na condensation, PNa is ~2.7x10⁻⁶ bar at a dust enrichment of 1000x, almost three times higher than that at 300x. Because of this and the slightly higher fO2 in the most dust-enriched systems, 800x and 1000x, a significant fraction of the Na condenses into the liquid above 1400K. As a result, below 1400K, Na2O contents of the calculated liquids at dust enrichments of 800x and 1000x are in the range of those of many of the chondrules shown, and the calculated PNa is very similar for all dust enrichments, varying from ~3.2x10⁻⁷ bar at a dust enrichment of 800x to ~4.8x10⁻⁷ bar at 1000x at 1350K. The most important reason why the Na2O contents of the liquids at the highest dust enrichments reach the levels found in chondrules while those at the lowest dust enrichments, 300x and 500x, do not is the persistence of the former to lower solidus temperatures, ~1300K vs. ~1400K (Fig. 8). As discussed above, this is due to higher FeO and Na2O contents of the liquids in the more dust-enriched systems at 1400K. At constant dust enrichment, our calculations show that maximum alkali contents of the liquids decrease substantially with decreasing Ptot. Even at Ptot as high as 10-4 bar and a dust enrichment of 1000x, for example, the maximum Na2O content of the liquid is at least a factor of 5 smaller than at 10-3 bar and the same dust enrichment. Except for the Type I chondrule glasses with Na2O/FeO wt ratios > 2.0, and Type II chondrule glasses with very high FeO and Na2O contents, all the chondrule glass compositions examined here could represent silicate liquids in equilibrium with dust-enriched vapor within 200 degrees of their solidus temperatures at Ptot > 10-4 bar. Even if the precursors of the most FeO- and Na2O-rich chondrules were melted in a gas enriched 1000x by dust, their liquids would have lost sodium by evaporation or FeO by reduction, assuming that they were hot for a long enough time to have equilibrated with the gas. |