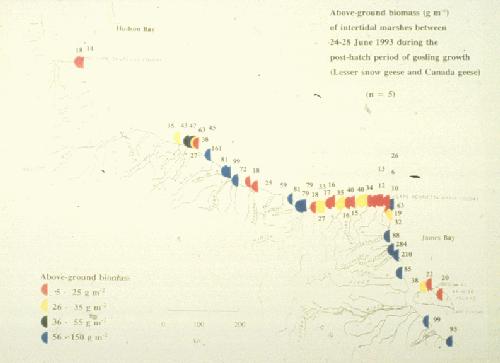
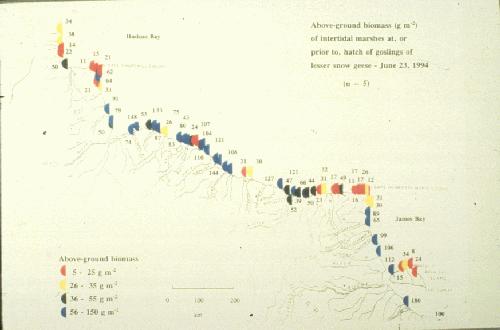
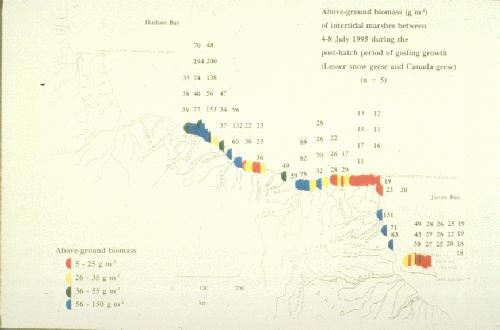
These show areas of lowest biomass (primary
productivity) in salt marshes based on 1993-1995 studies.
Sampling in 1994 occurred before goose hatching and the low
biomass even before significant grazing by goslings shows the
accumulated effect over years where snow goose colonies and major
spring staging activities occur (recall the earlier map).
1993
1994
1995
next slide | previous slide | slide show opening
revised - 12/18/02