On April 5, 2001, the paper "High
Velocity White Dwarfs: thick disk, not dark matter" by I. N.
Reid, K. C. Sahu and S. L. Hawley appeared on the LANL astro-ph preprint server.
The paper makes the claim that all but four of the stars in the Oppenheimer,
Hambly, Digby, Hodgkin and Saumon paper (2001, Science, 292,
698; hereafter OHDHS) are actually members of the so-called "thick disk"
of the Milky Way. The argument is based on the details of the distribution
of the stars in the radial (U) and rotational (V) galactic velocities.
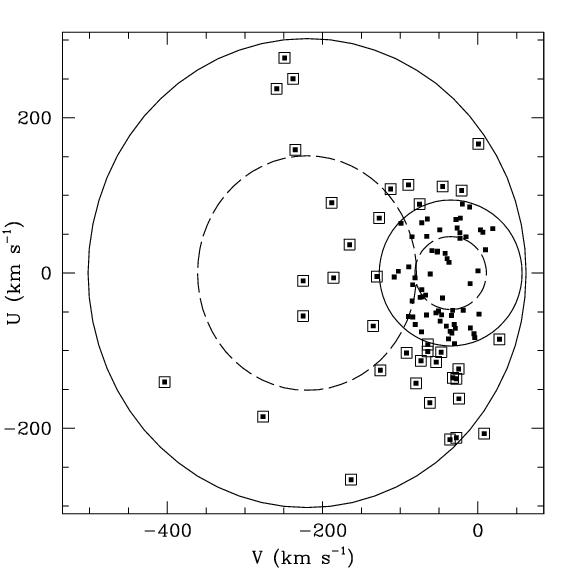
There appears to be
a concentration of the points in the new survey toward the circles that
indicate the one and two sigma velocity dispersions of the thick galactic
disk. This suggests that the sample of halo white dwarfs in OHDHS
is contaminated with disk white dwarfs and, therefore, the space density
we derived is incorrect. First, a concentration toward the disk distribution
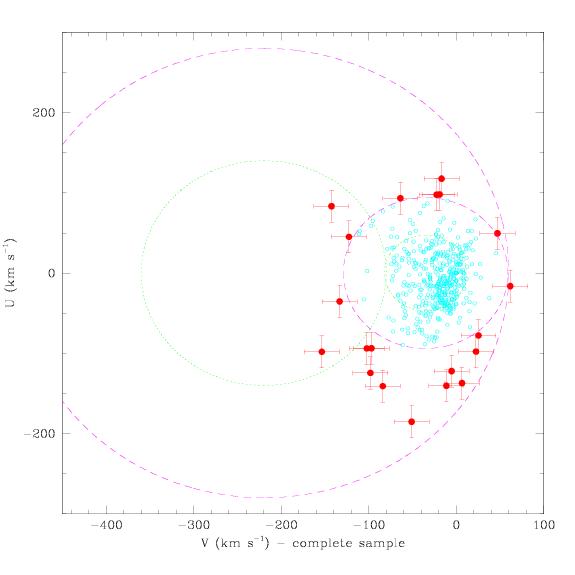
is apparent in the left side of Figure 1 above. However, one can
also note that in the right side of Figure 1, only 3 stars sit outside
the 3 sigma circle (not drawn). Clearly, then, with only a cursory
look at the issue, one can easily see that there may be a second distribution
of stars in the left hand figure, or that a very large number of extremely
high velocity stars are missing from the right hand figure, if both plots
represent the same population of stars.
Let us examine the Reid et al. argument more carefully and quantitatively,
though, beginning with Section 2 of their paper.
1. The assumption of zero radial velocity introduces errors in the Reid et al. analysis.
Reid et al. argue that one can reforge the VU velocity plot with the assumption that the radial velocity of each star in the OHDHS sample is zero rather than that W = 0, where W is the velocity perpendicular to the galactic disk. This is a true statement. In fact whichever assumption one uses has little impact on the outcome of the subsequent analysis. However, Reid et al. did not use the full sample of 99 white dwarfs plotted in our VU velocity diagram. If they had, they would have found that although the positions of the stars in this diagram shift when the assumption is changed, the number of stars in the halo sample remains the same. They state that by assuming that the radial velocity is zero, several white dwarfs are removed from the sample. If the entire sample of 99 stars plotted in our VU diagram had been used, they would have found that the number remains the same. Reid et al., however, continue the subsequent arguments of their paper, without using the entire sample of 99 stars plotted in our VU velocity diagram. This introduces errors in the rest of the paper. If they had the full catalog of stars plotted, they could have continued their argument on the assumption of zero radial velocity.
2. Reid et al. assume that the survey was uniformly sensitive to stars of all velocities.
The next assumption in the Reid et al. argument is that the OHDHS survey uniformly probed the entire VU parameter space plotted in Figure 1 above. They state:
"The most striking attribute of Oppenheimer et al.'s Figure 3 [Figure 1 above, left] is the uneven distribution of velocities: the halo 1 and 2 sigma ellipsoids are plotted for zero rotation and a dispersion of 120 km/s; a non-rotating population with those kinematics would be expected to be concentrated largely within the 1 sigma contours. In fact only 9 of the 38 white dwarfs fall within the halo 1 sigma contours. Moreover, there is an obvious concentration of stars around the boundaries of the disk 2 sigma velocity ellipsoid. This is exactly the behavior that one expects for the high velocity tail of a rotating population, not a non-rotating, pressure supported halo.
Oppenheimer et al. argue that the observed distribution is skewed by difficulties in detecting very high-motion objects; however, this effect cannot be significant, since with an average distance of 73 parsecs, their upper limit of 3 arcsec/yr corresponds to a transverse motion of 1040 km/s. . . . This selection effect does not account for the scarcity of white dwarfs with retrograde motion."First, if Reid et al. had not assumed that the radial velocities were zero (point 1 above), they would have found 16 of the 38 halo stars within the 1 sigma contour. However, this is still far fewer than expected for a standard distribution.
3. Reid et al. attempt to derive a space density of the white dwarfs in the thick disk that should lie outside the 2-sigma ellipse. It is highly uncertain and weakly based.
The derivation uses 7 white dwarfs known within 8 parsecs of the Sun, and
adds 10 main sequence stars, which the authors say would become white dwarfs
if they were part of the thick disk, presumed to have formed 10 Gyr ago
in a single burst of star formation.
There is a slew of papers on this subject and none of them seem to agree
with the Reid et al. calculation, some being discrepant by factors as large
as 25. To get the local density of WD, one could, for example, integrate
the Liebert, Dahn and Monet (1988; LDM) luminosity function of thin disk
white dwarfs. That provides 43 stars. In 1988, LDM did do this and
calculated 3 x 10⁻³ pc-3,
whereas the Reid et al. use 6.5 x 10⁻³
pc-3. Furthermore,
Festin (1998, A&A 336, 883) calculated 1.5 x 10⁻²
pc-3 for 7 white dwarfs
found by using opaque nebulae to define a volume complete sample.
Ruiz and Takamiya (1995, AJ, 109, 2817) determined a density a factor of
3 higher than the LDM88 value, and Oswalt et al. (1996, Nature, 382, 692)
derived 8 x 10⁻³.
These values are far more significant than the hand waving argument presented
in the Reid et al. paper. The main point is that this estimate is
subject to large uncertainties, while Reid et al. attempt to make a budget
of white dwarf densities from each component of the galaxy at accuracies
far exceeding the accuracy of their thick disk density.
Another problem with this calculation of the thick disk white dwarf space
density is that it assumes not only that the IMF is the same for both the
thick and thin disks (which the Reid et al. state), but also that they
have the same star formation history. Studies of the thick disk universally
agree that this second assumption may be quite incorrect. Rather,
most discussions of the thick disk assume a non-constant star formation
rate, with the majority of stars formed 10 Gyr ago.
4. The sample of stars used to represent the thick disk population are, in Reid's own words, not representative of the thick disk.
The Reid et al argument against OHDHS uses the sample of stars from Reid, Hawley and Gizis (1995; RHG95) to suggest that 4% of the thick disk distribution is outside of the 2-sigma circles drawn in the velocity diagrams. However, The RHG95 paper clearly states that the 514 stars in their complete sample exhibits a surprisingly large proportion of high velocity stars. One can compare this to the Reid and Majewski (1993) distribution, for example. Furthermore, one of the problems with using the RHG95 sample is clearly shown by a direct quotation from that paper:
"Both the U and W distributions [of the 514 M dwarfs] could be represented using a two component model, and it is tempting to identify the higher dispersion stars as a distinct component (a la `thick disk'). However, the implied local density normalization (~15-20% of the `classical' disk) is significantly higher than any of the estimates currently in the literature . . ."(Indeed, a table is provided in Reid and Majewski 1993.) The text in RHG95 goes on to explain that the distribution is likely missing some "~30-40 low-velocity stars" at the low luminosity end. Thus, in Reid's own words, this particular sample may not be representative sample of the thick disk kinematics. Is it, therefore, reasonable to use it to assert that some other sample of stars exhibits thick disk kinematics? Certainly it is clear that the stars from the RHG95 distribution lying outside the 2-sigma ellipse are not halo stars, but a critical point in the arguments presented in the paper is the relative number of halo and disk stars. It is not clear that the sample used represents the best indication of the absolute number of thick disk stars. Furthermore, if the percentage of thick disk stars outside of the 2-sigma ellipse is reduced (by virtue of the addition of low velocity, thin disk stars to the RHG95 sample), then the significance of contamination of the OHDHS sample is reduced.
5. The final argument takes a very extreme cut on the OHDHS sample and accepts four stars as members of the halo. Accepting this extreme point of view means that there are still far too many halo white dwarfs to be consistent with the standard picture of the stars in the halo.
The final argument of the paper accepts four retrograde stars (with V <
-220 km s-1) as actual
members of the halo and then computes a space density for them, claiming
that they are consistent with the expected halo white dwarf population.
There are a few inconsistencies in this argument.
First of all, if one does take this very extreme point of view that the
only stars in our sample that we can be certain are members of the halo
are these retrograde stars, then using our own diagram (where W is assumed
to be zero), this number rises to 8 stars, and of course the space density
increases accordingly. However, let us first examine the calculation
of the halo WD density while accepting the Reid et al. arguments.
If they had included the adjustment to dmax
including the lower proper motion limit of the survey, the number density
rises from their value of 1.5 x 10⁻⁵ pc-3
to
2 x 10⁻⁵ pc-3.
Accepting their doubling (to account for the prograde stars that are missed)
brings this up to 4 x 10⁻⁵.
This is already becoming uncomfortable for the value one expects from the
standard halo (2.6 x 10⁻⁵ pc-3,
which comes from the known space density of low mass stars in the halo
and the assumption of a standard initial mass function, a calculation by
Gould et al. 1998). This also implies that the OHDHS sample includes
all of the local halo white dwarfs of all luminosities. If that were
true, the galaxy's halo would be much younger than any other observation
indicates, since the oldest star in this sample is about 10 Gyr old.
Alternatively, using the 8 retrograde stars from our figure, the space
density is 2.5 x 10⁻⁵.
Doubling that gives 5 x 10⁻⁵,
a factor of 2 above the expected value. Incidentally, to accept such
a space density of white dwarfs in the halo, means that at least 0.5% of
the halo dark matter is made of white dwarfs. If one wishes to argue
that these are in the thick disk as well, a notion that even Reid et al.
are not comfortable with, the thick disk mass will rise well above the
accepted values, without even accounting for the additional mass of the
other stars in the survey, nor for the possibility that there may be a
substantial number of stars missed by the survey, particularly at fainter
magnitudes.
6. So it is clear that even accepting the most extreme of the Reid et al. arguments still results in a substantially higher number of white dwarfs in the galaxy's halo than are expected. Perhaps OHDHS did accept too much contamination from disk stars. What would be an appropriate cut that allows virtually no contamination?
The argument that one should only take the retrograde stars and multiply
by two is not very rigorous. There is strong evidence, most recently
in the Chiba and Beers (1999), that the notion of a completely separate
halo and disk is too simplistic. Indeed, their work indicates that the
halo itself, as indicated by the lowest metallicity stars, is rotating
near the plane of the disk, with a strong gradient in rotational velocity
away from the plane. Only the extreme halo with |Z| > 1.2 kpc has
no rotation. Within 200 pc of the galactic plane, where the OHDHS
survey looked, halo stars rotate at 70 to 80 km/s. This necessarily
moves the halo and disk distributions closer together in the UV parameter
space (Figure 2, below). This, along with the fact that Reid et al.
will accept the retrograde star very close to the center of the halo distribution
in their plot, but not those that are prograde and much further away from
the disk distribution strongly indicates that their criteria are far too
strict. The use of only retrograde stars also is inconsistent with
the repeated mentioning of disk distributions in terms of normal Gaussian
(in truth, Maxwellian) distributions of stars in velocity space.
The main issue here is what is the appropriate cut to make, which depends
on the relative numbers of disk and halo WDs at the luminosities of our
survey. One can argue about 2, 3, 4 sigma cuts, but it is also important
to realize that the larger the cut, the larger the slice of the halo distribution
one excludes. A correction for this deficit will be necessary.
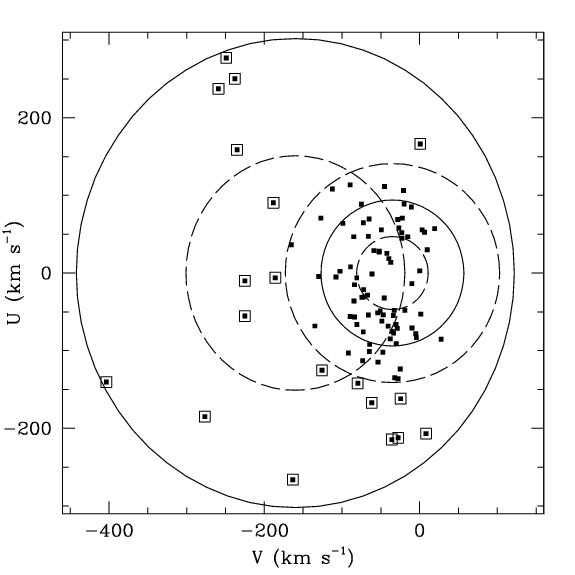
Figure 2. This plot shows the V and U velocities of the OHDHS sample with a 3 sigma cut on the disk distribution. In addition, the halo ellipses are moved to the positions indicated in the Chiba and Beers (1999) study of non-kinematically selected stars as a probe of galactic dynamics. Chiba and Beers show that the lowest metallicity stars, the oldest members of the galactic halo, actually exhibit a small amount of rotation near the plane of the galaxy. This shifts the halo distribution to the position in this figure. By removing any stars which sit within the 3 sigma ellipse of the thick disk distribution about 24% of the halo distribution is removed as well.
Suppose for a moment that a 3-sigma cut is made (Figure 2). In comparison
to the Reid et al. distribution (Figure 1, right, above), this only permits
3 out of 514 of their M dwarf sample into the halo, i.e. 0.6%. 19
out of 38 of the stars in our sample (or 19 of 99 plotted in Figure 1,
left, above) lie outside the 3 sigma disk circle (using our W = 0 calculations).
The space density of those is 5 x 10⁻⁵
pc-3, 2.4 times higher
than the Gould estimate. Accounting for the area lost to the cut
(a factor of ~1.3), yields 6.7 x 10⁻⁵
pc-3 , a factor of
almost 3 above the expected halo density, and half a percent of the local
halo dark matter density.
No matter what cut is used, the OHDHS survey indicates that there are more
white dwarfs in the halo than are expected. This even applies to
the extreme argument that allows only the retrograde stars in the sample
of halo stars.
7. OHDHS only determined a lower limit. If the VU parameter space were more uniformly sampled, or if the limiting magnitude of the survey were higher, it is very likely that many more halo white dwarfs would have been found.
There are several reasons that the OHDHS survey only provides a lower limit
to the number of white dwarfs in the halo, meaning that many more exist
beyond the various detection limits of the survey.
For example, one can examine the luminosity function of the 3-sigma cut
mentioned above. This is shown in Figure 3.
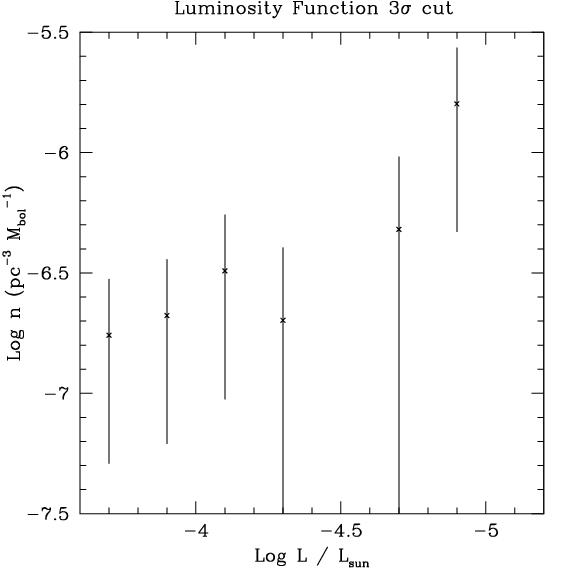
Figure 3. The Luminosity function of the 19 halo white dwarfs outside the 3-sigma velocity ellipse for the thick disk. Bolometric corrections for the photographic bandpasses used in OHDHS are provided by Didier Saumon and are calculated from the models of Saumon and Jacobsen (1999).
This luminosity function
is strongly rising toward lower luminosities. It is completely inconsistent
with the luminosity function of white dwarfs in the galactic disk.
This is strong evidence that the entire population of white dwarfs to which
the OHDHS sample belongs has not yet been found and that there may be many
more white dwarfs with much lower luminosities. For example, if the
function continues at the trend shown here, by including only the
next data point will raise the space density of the 3-sigma cut by a factor
of 3. Even if the next point is only comparable to the faintest plotted
here, the space density rises by a factor of 1.8. This brings the
calculated space density back to the value reported
in OHDHS.
Finally, there is one other point which may distort the discussion of the
OHDHS sample. One expects some of the objects in the sample to be
WD-WD binaries. If some fraction of the points in Figure 1 (left)
or Figure 2 are in fact representing binaries, they are situated up to
a factor of sqrt(2) too close to the origin of the plot. Parallaxes
of these stars would remove this bias, but without the parallaxes, it is
a point that should be considered.
© 2001 by Ben R. Oppenheimer. This material may not be reproduced, copied or used elsewhere without explicit written permission of the author.